
在日常运维中,监控Nginx的性能和运行状态是确保系统稳定性的重要手段之一。通过Prometheus与Nginx Exporter的结合,可以实现对Nginx的监控。本文将简要介绍如何配置Nginx和Prometheus,实现对Nginx的指标采集和监控。
一、配置Nginx的状态监控
首先,我们需要配置Nginx的状态页面,使其能够提供一些基本的运行指标。
Nginx官方文档:https://nginx.org/en/docs/http/ngx_http_stub_status_module.html
1. 启用http_stub_status_module 模块
Nginx提供了http_stub_status_module模块,用于暴露一些基本的状态信息,我们需要通过编译安装来启用它,如果你已经编译按照了nginx,可以通过nginx -V 命令查看先前的编译参数,并在此基础上添加--with-http_stub_status_module 模块重新编译。
2. 配置stub_status
编辑Nginx的配置文件(通常位于/etc/nginx/nginx.conf或/etc/nginx/conf.d/目录下),添加一个新的location块,用于暴露状态信息:
server {
    listen 8080;
    server_name 127.0.0.1;

    location /nginx_status {
        stub_status on;
        access_log off;
        allow 127.0.0.1;
        deny all;
    }
}
配置完成后,重新加载Nginx配置:
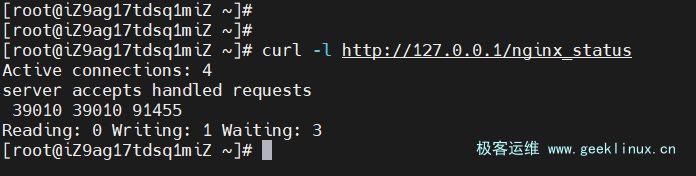
nginx -s reload现在,访问http://127.0.0.1:8080/nginx_status,应该能看到类似内容

二、安装Nginx Prometheus Exporter
Nginx Prometheus Exporter用于将Nginx的状态信息转换为Prometheus能够采集的格式。
1. 下载Nginx Prometheus Exporter
Github:https://github.com/nginxinc/nginx-prometheus-exporter/
https://github.com/nginxinc/nginx-prometheus-exporter/releases/download/v1.3.0/nginx-prometheus-exporter_1.3.0_linux_amd64.tar.gz
tar -xzvf nginx-prometheus-exporter_1.3.0_linux_amd64.tar.gz2. 启动Exporter
运行Exporter,指定Nginx的状态页面URL
chmod a+x /usr/local/sbin/nginx_exporter
/usr/local/sbin/nginx_exporter -nginx.scrape-uri=http://127.0.0.1:8080/nginx_status这将启动Exporter并将Nginx的状态信息转化为Prometheus可识别的指标,通常在http://localhost:9113/metrics暴露。
3.配置Systemd
cat > /etc/systemd/system/nginx_exporter.service <<EOF
[Unit]
Description=nginx exporter for localhost

[Service]
ExecStart=/usr/local/sbin/nginx_exporter -nginx.scrape-uri http://127.0.0.1:80/nginx_status
Restart=on-failure
StandardOutput=journal
StandardError=journal

[Install]
WantedBy=multi-user.target
EOF
配置完成后不要忘记 daemon-reload😊
检查一下metric
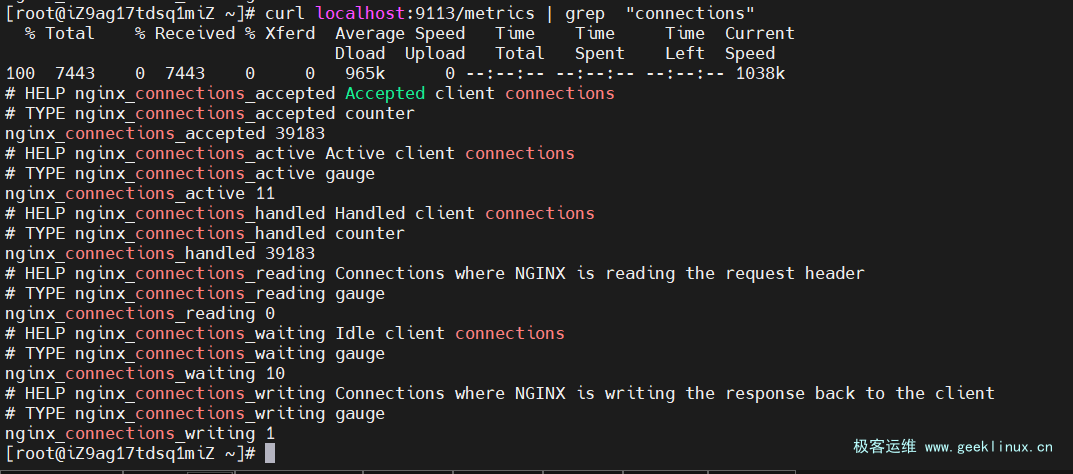
z这里metric相关参数值说明如下
这里的指标都是来自stub_status模块
| 名称 | 说明 | 标签 |
|---|---|---|
| nginx_connections_accepted | 已接受的客户端连接 | [] |
| nginx_connections_active | 活动的客户端连接 | [] |
| nginx_connections_handled | 处理客户端连接 | [] |
| nginx_connections_reading | NGINX 正在读取请求标头的连接 | [] |
| nginx_connections_waiting | 空闲客户端连接 | [] |
| nginx_connections_writing | NGINX 将响应写回客户端的连接 | [] |
| nginx_http_requests_total | http 请求总数 | [] |
| nginx_up | NGINX状态;1表示抓取成功, 0表示抓取失败。 |
三、配置Prometheus
现在,我们需要将Exporter集成到Prometheus中。编辑Prometheus的配置文件(一般是prometheus.yml),添加新的scrape目标,可以添加 instance 标签来判断目标主机信息,建议使用真实的 IP 进行替换以便更加直观
scrape_configs:
  - job_name: 'WebServer'
    static_configs:
      - targets: ['localhost:9113']
        labels:
          instance: 'server'
保存配置并重新启动Prometheus:
systemctl restart prometheus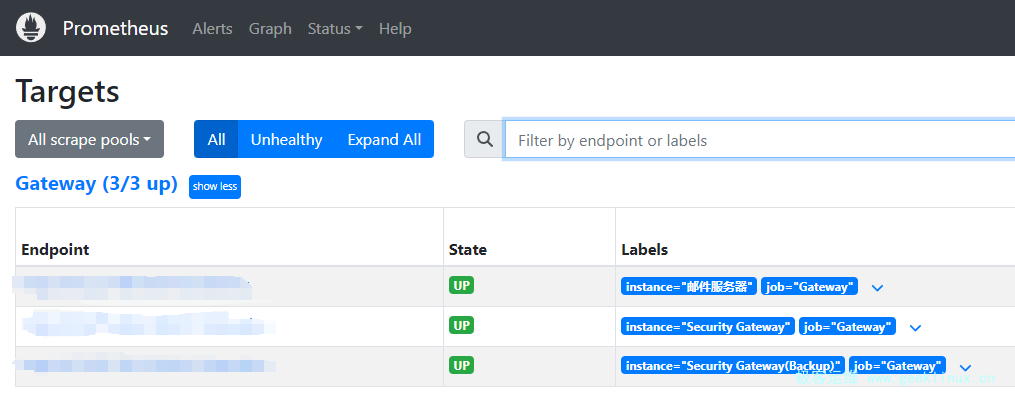
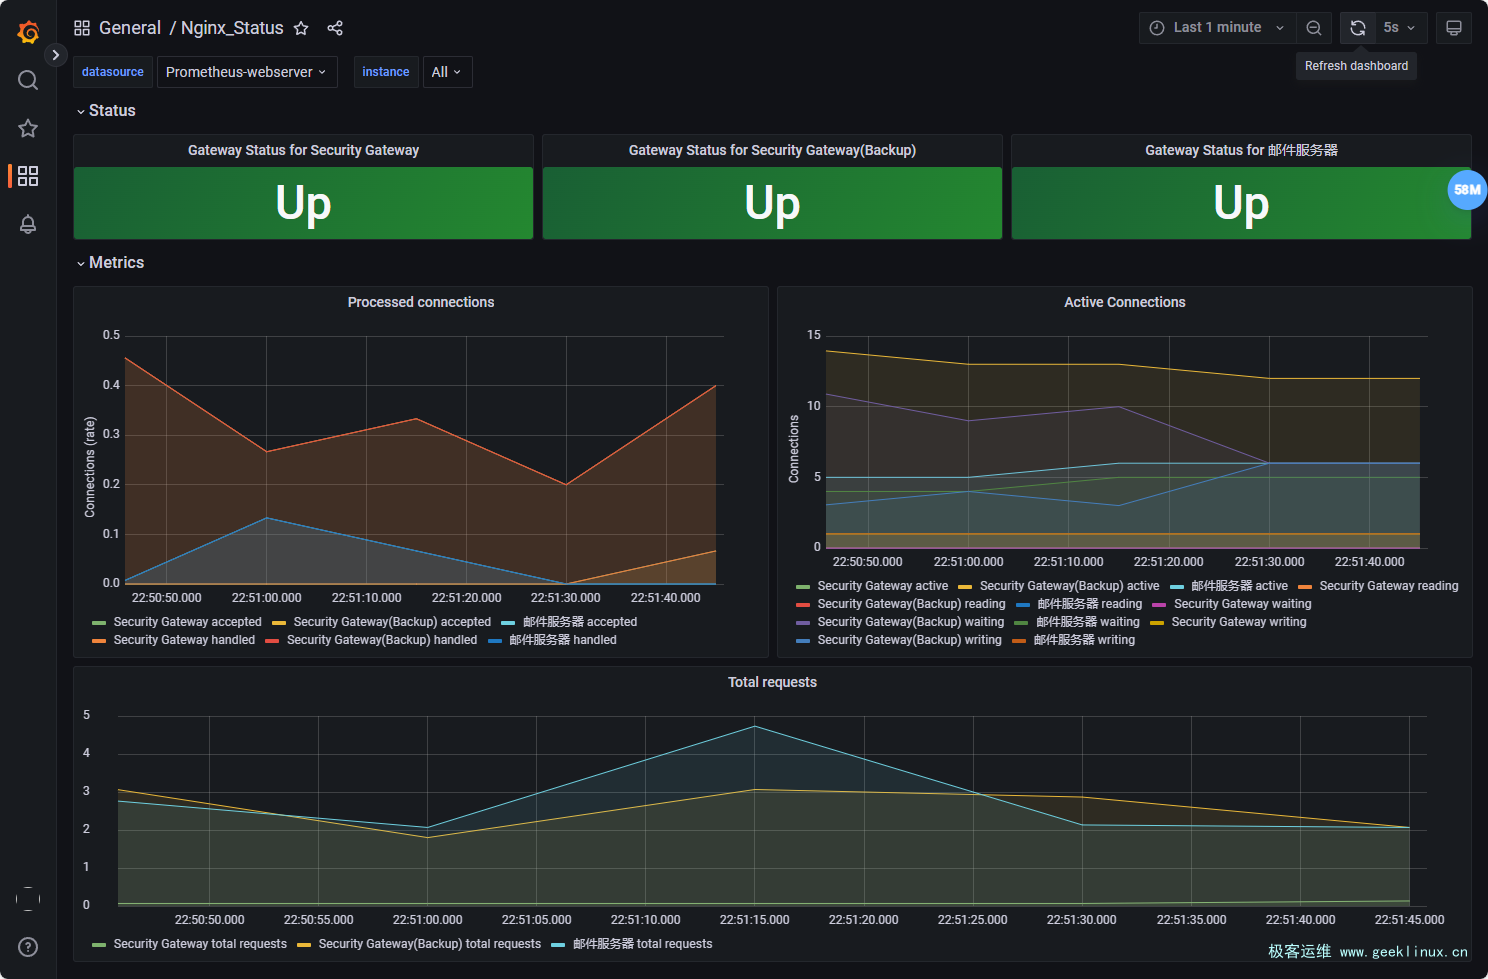
四、Grafana添加
https://github.com/nginxinc/nginx-prometheus-exporter/blob/main/grafana/dashboard.json
下载完之后导入到Grafana即可
原创文章,作者:geeklinux.cn,如若转载,请注明出处:https://www.geeklinux.cn/jsjc/nginx/363.html